On weekdays last week, peak came in on average 8-9% lower (~7,500 MW) than what we would have anticipated. The largest impacts thus far were around 10-11% on March 26th and 27th(~9,500 MW)
Latest Post | Last 10 Posts | Archives
Previous Post: The decline may not be as fast as the rise
Next Post: SUBSCRIBERS ONLY - Supplement to today’s edition
Posted in:
Posted by Barton Lorimor
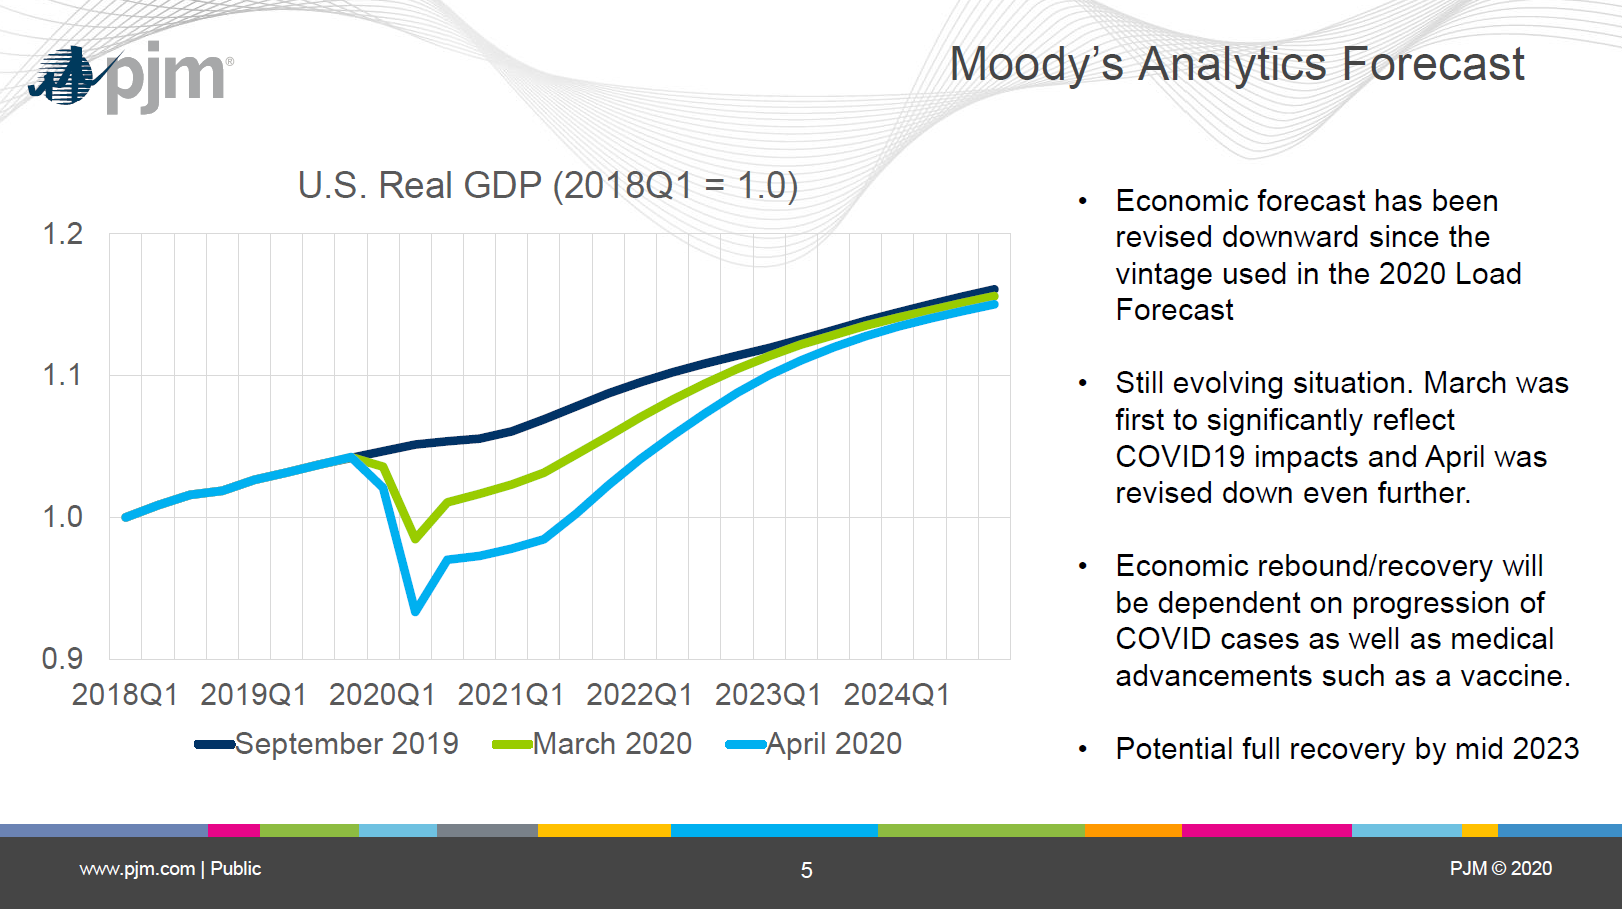
* Full economic recovery from a COVID-19 recession is not expected until the first quarter of 2023, say analysts for a major electric grid operator in 15 states and parts of Canada.
In an open meeting of its Planning Committee yesterday, PJM Interconnection repeated Moody’s Analytics’ belief the 2020 recession would cut the country’s GDP by 2.3 percent this year. The projections are important information for utilities as they try to grapple with a sudden departure from economic forecasts set earlier this year before COVID-19 contingency plans were thought to be required. It also comes at a time when electric load data is filling a void left by many traditional indicators many economists believe are faltering because of the sudden shift.
Andrew Gledhill, who presented the findings on behalf of PJM, said the recovery timeline is based on the presumption a vaccine is available by mid-2021, which may or may not happen, of course.
* PJM analysts say electric peaks have missed their projections by as much as 10 percent in some instances throughout the organization’s territory, which includes metropolitan Chicago. The most dramatic departures are on weekdays when residential and commercial loads resemble what is normally observed during a recession, Gledhill said.
A copy of the presentation is available here.
From the presentation materials…
On weekdays last week, peak came in on average 8-9% lower (~7,500 MW) than what we would have anticipated. The largest impacts thus far were around 10-11% on March 26th and 27th(~9,500 MW)
The drop off is observable on March 16. For context, that was the Monday before Gov. JB Pritzker and his counterparts in other states began issuing stay-in-place orders. Slowdowns are even more evident the following week…
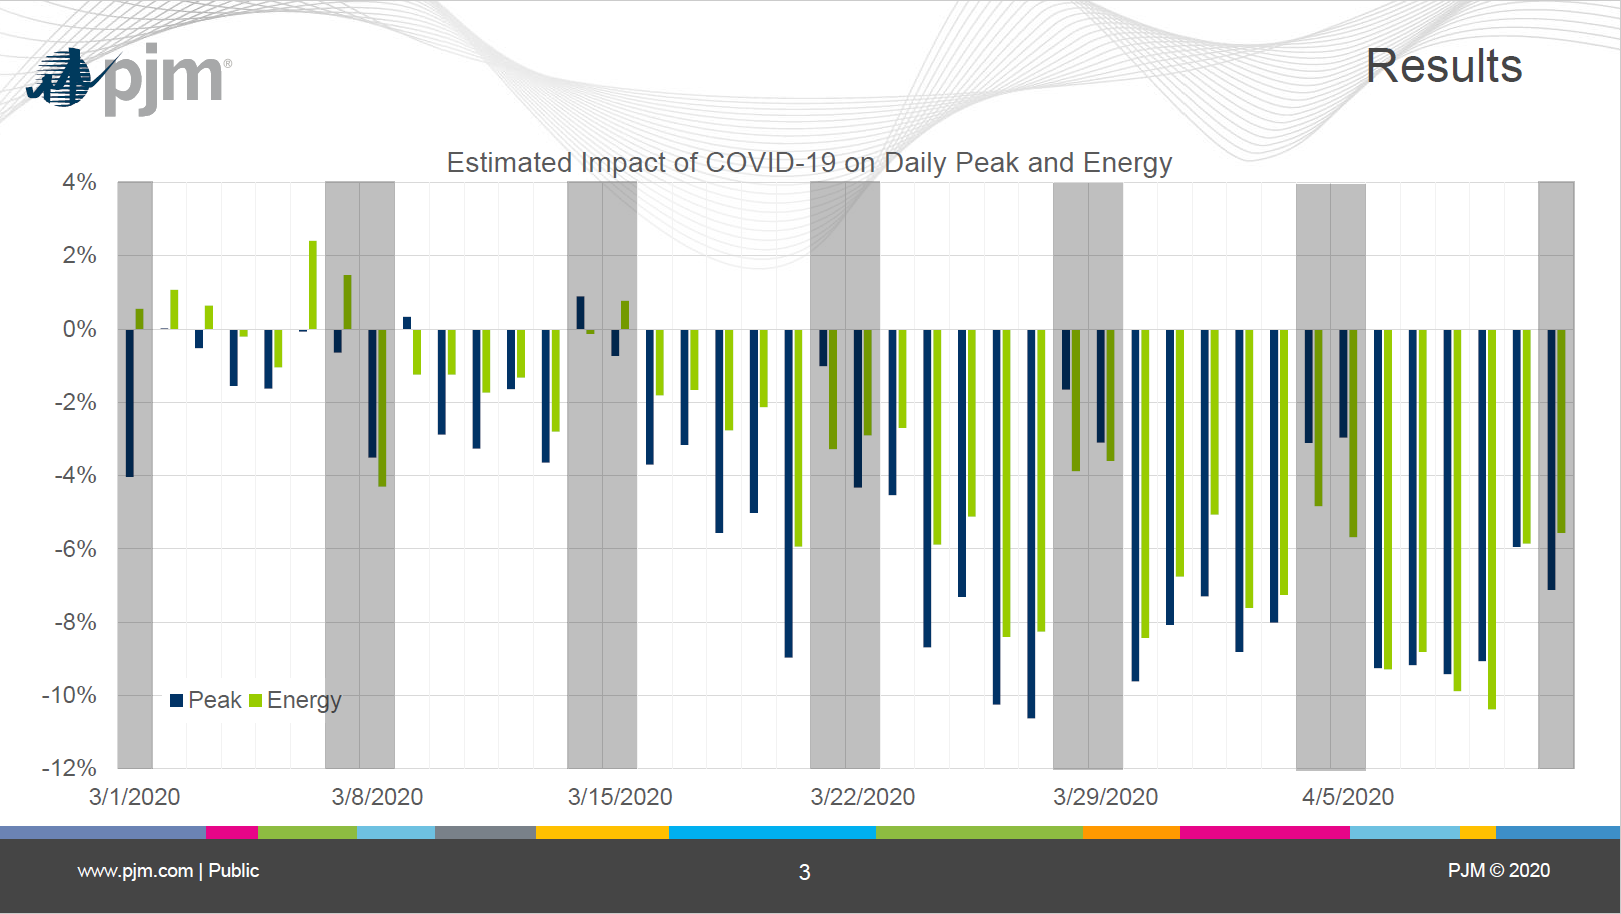
This is preliminary data, so it is possible factors such as weather or solar energy could be altering the figures a bit. Gledhill said weather in March was “pretty atypical.”
* Our own analysis of PJM’s preliminary data for northern Illinois shows usage also appears to be slipping compared to loads in 2019, and at the same time highlighted by Gledhill…
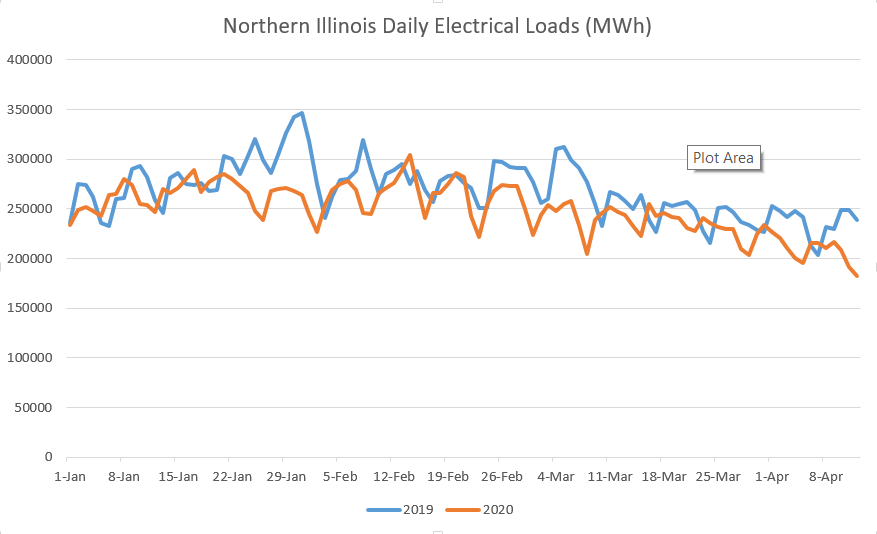
Again, this is the preliminary data, which does not factor in the weather. That said, it would take a pretty significant weather event to make up for some of these readings.
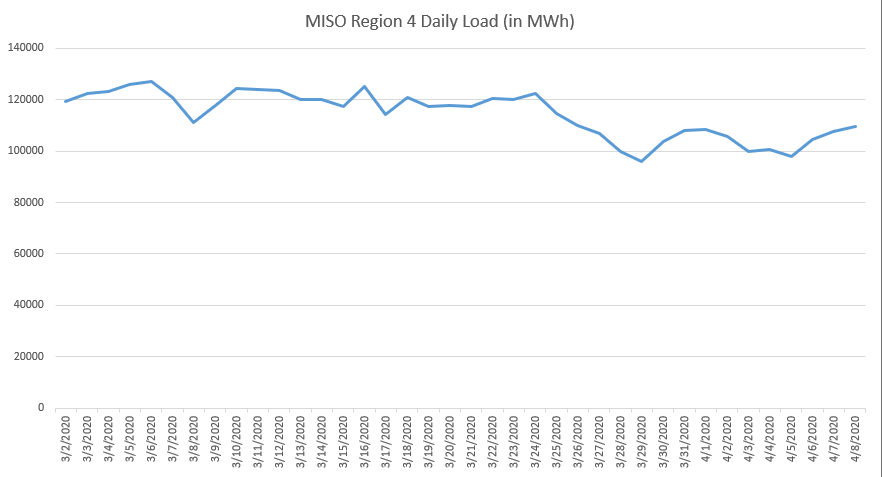
* Some of what Gledhill said about PJM’s system-wide data struck a chord because they were trends we also noticed earlier this week while analyzing daily load data from MISO, which operates the grid used by Ameren Illinois customers. For instance, the March 23 dropoff is noticeable here, too…
posted by Rich Miller
Wednesday, Apr 15, 20 @ 9:19 am
Sorry, comments are closed at this time.
Previous Post: The decline may not be as fast as the rise
Next Post: SUBSCRIBERS ONLY - Supplement to today’s edition
WordPress Mobile Edition available at alexking.org.
powered by WordPress.
Yes, it’s a wonky post, but Barton is a wonk, so let’s welcome him back.
Comment by Rich Miller Wednesday, Apr 15, 20 @ 9:20 am
Love the identification and usage of an alternative leading indicator for economic activity. I agree “traditional” models relying on “classic” leading indicators cannot adjust fast enough to provide any guidance. Don’t love the projected recovery timeframe, although I likely agree with it. Just don’t see how things get back to “normal” without: 1. an effective vaccine is widely available 2. Reliable antibody testing to indicate an individual’s developed the necessary resistances
Comment by Chambanalyst Wednesday, Apr 15, 20 @ 9:31 am
Wonky, but interesting.
Comment by Birdseed Wednesday, Apr 15, 20 @ 9:32 am
Love the data showing usage dropped about a week before the Gov’s stay in place directive. Further support for the idea that it’s the virus (and fear of illness/death) that keeps most people out of stores/venues…not hyperbolic govenors’, scientists’ and health professionals’ efforts to contain the pandemic.
Comment by Froganon Wednesday, Apr 15, 20 @ 10:25 am
Thanks, Barton.
The wonky to this pandemic… is a needed side.
Comment by Oswego Willy Wednesday, Apr 15, 20 @ 10:26 am
“The drop off is observable on March 16.”
Perhaps a portion of that week’s dropoff is attributable to the closure of schools, bars & restaurants in IL.
“Love the data showing usage dropped about a week before the Gov’s stay in place directive.”
Why do you “love” it? Confirmation bias?
Comment by Anon62704 Wednesday, Apr 15, 20 @ 10:47 am
PJM’s 2019 vs. 2020 chart also doesn’t line up weekends. With leap year, no weekend dates overlap between 2019 and 2020.
Comment by Ok Wednesday, Apr 15, 20 @ 11:20 am
I generally don’t think that 3electricity usage week to week can be any good indicator of economic activity. Weather is the most signficant variable - the end of march and beginning of april are our least energy intensive times of the year. Also, when things such as schools close, that can have a huge impact on load, but have no indicator of economic activity.
Further, when people work from home, what is the electric use saying about their economic activity?
It is a very weak signal. At best.
Comment by Ok Wednesday, Apr 15, 20 @ 11:23 am
Wonky, but funner than a ride down the giant slide at the Illinois State Fair. Good work, Barton.
Comment by Cheswick Wednesday, Apr 15, 20 @ 11:47 am
While it may not impact over all economy but take into consideration the large facilities that are closed that will reopen. Summer weather and when large facilities open back up will impact peak usage which are key factors electrical generation needs.
Comment by theCardinal Wednesday, Apr 15, 20 @ 11:55 am
= PJM’s 2019 vs. 2020 chart also doesn’t line up weekends. With leap year, no weekend dates overlap between 2019 and 2020. =
That is very true. However, if you look at PJM’s full presentation, they do identify weekends in comparing 2020 data to five-year averages. The big caveat is that data represents consumption in 15 states and Canada - not just ComEd / northern Illinois.
If I am allowed a follow up as more data becomes available, matching weekends and adding more years to the ComEd plot is absolutely a goal.
Comment by Barton Lorimor Wednesday, Apr 15, 20 @ 12:06 pm
I also want to explore the MISO data a little more. It’s a smaller load in Illimois compared to PJM, but I am curious to see some of the nuances between the regions in how they are responding to the virus.
Comment by Barton Lorimor Wednesday, Apr 15, 20 @ 12:10 pm