Latest Post | Last 10 Posts | Archives
Previous Post: *** UPDATED x1 *** Chicago FOP to licensing proponents: “Bring it on”
Next Post: *** UPDATED x2 *** Pritzker sidesteps tax hike question, says he’s still waiting on legislative leaders to suggest cuts
Posted in:
* From the most never-wrong expert on everything COVID…
Now @GovPritzker has some explaining to do. According to this new “science and data,” Resturants and Bars, YOUTH travel sports, group classes at gyms should be open! We’ll discuss @MorningAnswer
IDPH releases potential exposure locations https://t.co/wpM3YQbNxZ
— Amy Jacobson (@AmyJacobson) December 7, 2020
* From the linked article…
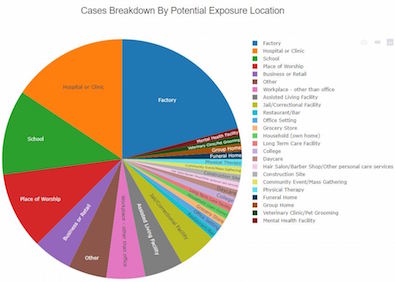
The Illinois Department of Public Health released information on the rates of COVID-19 exposure throughout the state and where exposure is most prominent.
The Governor has pointed out, in the past, restaurants, bars and schools top the list, but now we’re seeing different results.
The accompanying graph…
* The governor was asked about the decrease for bars and restaurants yesterday and he said the numbers have dropped because they’ve been closed for indoor service. Not all have closed, obviously, but the mitigations are clearly working.
posted by Rich Miller
Tuesday, Dec 8, 20 @ 10:03 am
Sorry, comments are closed at this time.
Previous Post: *** UPDATED x1 *** Chicago FOP to licensing proponents: “Bring it on”
Next Post: *** UPDATED x2 *** Pritzker sidesteps tax hike question, says he’s still waiting on legislative leaders to suggest cuts
WordPress Mobile Edition available at alexking.org.
powered by WordPress.
Oy vey. Hey Amy, when you do the right thing and shut down indoor dining, fewer infections come from indoor dining. This is not hard if you have even the most rudimentary brain capacity. Maybe that’s the problem.
Comment by Chicago Cynic Tuesday, Dec 8, 20 @ 10:11 am
Amy Jacobsen and Dan Profit have about 10 listeners between them on their morning show carried on that “blow torch” known as WIND.
Let’s be clear, they will always be on the opposite side of a Democrat Governor, et. al. because that’s where the controversy lives and breathes. The 10 people listening will tune out if those two ever agreed with a Democrat.
In short, who cares what she thinks?
Comment by Colin O'Scopy Tuesday, Dec 8, 20 @ 10:13 am
Typical hypocrite uses “science and data” when it fits their narrative, but ignores it when it doesn’t.
Comment by Steve Rogers Tuesday, Dec 8, 20 @ 10:14 am
So, science is working. The perfect time to stop doing science? She is so smrt.
Comment by Bruce( no not him) Tuesday, Dec 8, 20 @ 10:15 am
Also, the graph is much different for other IL regions, and statewide.
Comment by Brian Tuesday, Dec 8, 20 @ 10:18 am
I love how she put “science and data” in quotes, as if the two constructs must be treated with extreme skepticism. Seems odd coming from someone who graduated Phi Beta Kappa. Anyway, she once again OWNED the libs, and that’s all that matters.
Comment by Independent Tuesday, Dec 8, 20 @ 10:22 am
Mitigations in certain pieces of the pie may lower exposure risk. But, when some of those pieces decide to do no mitigation and actually flaunt mitigations, other pieces can grow in size. Bars and restaurants that welcome unmasked numbers are eventually placing hospitals and clinics at a higher risk for staff and patient exposures since some of their patrons end up at those settings. If they didn’t we wouldn’t have this information from contact tracing. The “Live Free or What’s the Point” maskless want their bars and restaurants, but I’m sure they want their “right” to a hospital bed, too. They just cannot see that they are putting that “right” in jeopardy every time they raise a glass or a drumstick and post those “cheers” for the world to see on social media. The Atlantic article was a hard look at prioritizations in COVID-19 cases. Car accident victims, cardiac patients, dialysis treatments, and even birth complications are being impacted throughout the hospital systems. COVID-19, from some of the recent news reports, can take up to 20% of a hospital’s overall capacity- beds, staff, equipment. So what’s worth more? A beer and a buddy selfie, or a hospital room and adequate care?
Comment by Anon221 Tuesday, Dec 8, 20 @ 10:22 am
I found the statewide graph and full table stats breakdown:
https://www.dph.illinois.gov/covid19/location-exposure?regionID=0
I’m surprised how low the “Government Facility” category is in Region 3 including Springfield (12), considering how some state offices have been “all in” the office for some time (e.g., Secretary of State despite the facility closures, Stratton Building). While quite high (ranging from 29-43 cases) in Regions 1, 2, 8, and 9. (Chicago data was not included in this graph).
https://www.dph.illinois.gov/covid19/location-exposure?regionID=0
Comment by State Employee Tuesday, Dec 8, 20 @ 10:25 am
Seems Amy should team up with open the Bars Alderman Chuck Redpath and Ralph Hanauer. I’m sure they could get an interview with Greg Bishop at the Center Square and then attend an event with Brad Halbrook and Darren Bailey.
Amy the Governor owes you no explanation. It’s right there in front of your eyes. Even I get it and I’m not a radio distraction.
Comment by Club J Tuesday, Dec 8, 20 @ 10:26 am
Check out those houses of worship. What are people doing there? Last time I was in a church it was for a funeral and people were spaced (they had pews blocked off), wore masks, and kept the service moving at a decent clip so folks weren’t gathered inside for a long time.
Comment by cermak_rd Tuesday, Dec 8, 20 @ 10:26 am
Place of worship and school. Religion can be so comforting but not this.
Comment by Amalia Tuesday, Dec 8, 20 @ 10:26 am
These data make it clear that one of the best ways to control the virus is to close hospitals /s
Comment by very old soil Tuesday, Dec 8, 20 @ 10:31 am
If Gov. Pritzker gets the vaccine early, Amy won’t care because the virus threat is overblown. Right?
Comment by Pot calling kettle Tuesday, Dec 8, 20 @ 10:42 am
That map used by WSILTV is a bit misleading. Maybe the numbers have changed since Dec. 3rd, but the Statewide map is drastically different than the one that was updated by the IDPH on the 4th.
Noticeably factories and restaurants/bars are not represented the same way in the December 4th pie chart.
https://www.dph.illinois.gov/covid19/location-exposure?regionID=0
Comment by Mr. Hand Tuesday, Dec 8, 20 @ 10:52 am
This article has more views than WIND has listeners.
Comment by ChuckIL Tuesday, Dec 8, 20 @ 10:53 am
I have wondered if she was always this way or is this something that has developed so she can work in the environment she is working in now. For want of a better way of putting it, is this a ‘character’?
Comment by OneMan Tuesday, Dec 8, 20 @ 10:54 am
“Typical hypocrite uses “science and data” when it fits their narrative, but ignores it when it doesn’t.”
Steve Rogers, you clearly aren’t paying attention. The science is working. That’s why closing restaurants and bars was so important. Now that they’re closed, people aren’t getting Covid there. Really not that complicated.
Comment by Chicago Cynic Tuesday, Dec 8, 20 @ 10:54 am
NB: the data are from the last 30 days only, so they reflect recent mitigation measures like closing indoor dining and limiting groups. School makes up a prominent or even largest source in every region, but that is “data” that is inconvenient to point out, apparently.
Comment by Jibba Tuesday, Dec 8, 20 @ 10:56 am
=I have wondered if she was always this way or is this something that has developed so she can work in the environment=
The operative word here is “work”. She needed a job after she disgraced herself for hanging out at the pool of a target in a missing mother’s case.
Once she found a “home” with Dan Profit, she was in for a dime, in for a dollar.
Comment by Colin O'Scopy Tuesday, Dec 8, 20 @ 11:15 am
This whole line of nonsense that this is a hoax to take away our freedom has been done to death, yet there still seems to be audience for it.
Comment by The Way I See It Tuesday, Dec 8, 20 @ 11:24 am
Very old soil for the win..
Comment by stateandlake Tuesday, Dec 8, 20 @ 11:26 am
==That map used by WSILTV is a bit misleading.==
That graph was only for Region 5 (which includes the WSIL viewing area) and was as of Nov. 27.
Comment by State Employee Tuesday, Dec 8, 20 @ 11:30 am
Interesting to me that planes and airports aren’t represented on the graph.
Comment by jaykaysr Tuesday, Dec 8, 20 @ 11:41 am
Factories top the list. Rep. Chris Welch just disclosed his Covid exposure was traced back to someone working at a Ford plant.
Comment by Because I said so.... Tuesday, Dec 8, 20 @ 11:51 am
===someone working at a Ford plant===
That plant has been a model of safety.
Comment by Rich Miller Tuesday, Dec 8, 20 @ 11:51 am
There’s no freedom quite like the freedom of clinging to life on a ventilator…
To the post, we’re seeing a drop in hospitilation rates so let’s open bars and restaurants.
Comment by Froganon Tuesday, Dec 8, 20 @ 1:02 pm
The problem with indoor dining is that when you take your mask off to eat you have to also breathe.
She is not relevant to me or anyone I know.
Comment by CitizensArrest Tuesday, Dec 8, 20 @ 1:22 pm
Why even bother parsing those pretty exposure charts? Per IDPH’s own disclaimer: “Locations provided by cases should be interpreted as locations where COVID-19 exposure may have occurred, not that these are definitive exposure or outbreak locations.”
It remains absurd that IDPH (and yes, Chicago’s Public Health Department) still haven’t been able to manage the level of actual outbreak reporting by region and setting that Michigan has provided for months.
https://www.michigan.gov/coronavirus/0,9753,7-406-98163_98173_102057—,00.html
And yes Michigan Public Health has their own prodigious disclaimer too, but they aren’t featuring pie charts of exposure data vs outbreak data as policy making tools.
Comment by ChicagoBars Tuesday, Dec 8, 20 @ 3:54 pm
Chicagobars, I understand several states have far better reporting - but be carefuk before assuming those states are not also guessing at exposure. Nonetheless, the IL charts only tell us where a person was prior to testing positive.
I think I read that Minnesota tracked about half of the positive tests and a very low percentage tracked to a bar or restaurant, fwiw.
Comment by Still Anon Tuesday, Dec 8, 20 @ 8:50 pm