

Latest Post | Last 10 Posts | Archives
Previous Post: ISP says it has cut DNA backlog nearly in half
Next Post: Oops
Posted in:
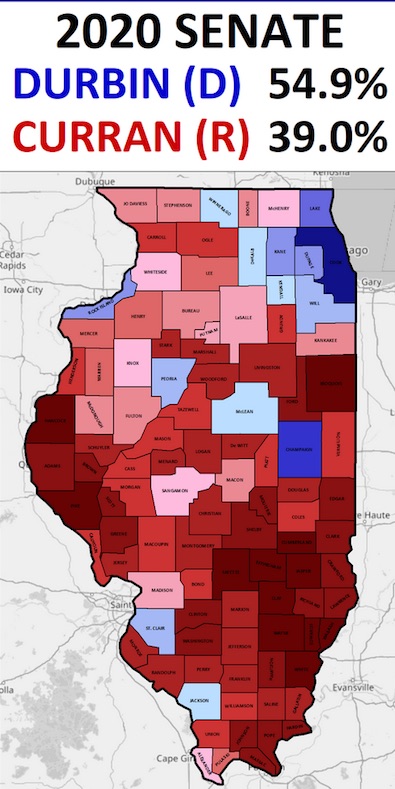
* From Sabato’s Crystal Ball…
* And here they are side-by-side for an easier comparison…

Don’t get hung up on the Durbin reference in comments. This isn’t really about him. It’s about how the state has changed and what the trends look like. Yes, the Democratic Party has a whole has to reverse the trend in small Downstate cities, but the statewide vote is in the city and the suburbs and the Republicans are just getting slaughtered.
You already knew that, of course, but the map is a good illustration.
* Narrative…
Durbin was first elected to the House in 1982, representing a Downstate district in between the Springfield and St. Louis areas. When another fellow Downstate Democrat, then-Sen. Paul Simon, retired from the Senate in 1996, Durbin ran for the seat, and he carried most counties south of St. Louis. As those demographically whiter and more rural counties have drifted Republican in past decades, Durbin’s coalition has increasingly become more urban and suburban.
This year, other than narrowly losing McHenry County, he carried every county that touches Chicago’s Cook; these formerly-Republican suburban counties are known collectively as the Chicago’s Collar Counties. In 1996, he lost the largest collar county, DuPage, by 10 percentage points — last month, Durbin got the same 55% there as he did statewide.
Durbin held a smattering of Downstate counties, but this seems like more a sign of his strength with white collar academics than blue collar workers — aside from St. Clair County in the St. Louis metro area, with its large Black population, every county south of Peoria that he won last month is home to a major university: Champaign (University of Illinois), McLean (Illinois State University) and Jackson (Southern Illinois University).
To be fair, Durbin did perform relatively well, compared to Biden, in the counties that made up his old congressional district. In rural counties such as Brown, Calhoun, and Macoupin, he ran double-digits ahead of the national ticket — but often, it was a case of Durbin polling in the 30s, compared to Biden, who was in the 20s.
…Adding… Tribune…
* How did your neighbors vote for president, Senate and the graduated-rate income tax amendment? Search our city and suburban map to find out.
posted by Rich Miller
Thursday, Dec 3, 20 @ 10:21 am
Sorry, comments are closed at this time.
Previous Post: ISP says it has cut DNA backlog nearly in half
Next Post: Oops
WordPress Mobile Edition available at alexking.org.
powered by WordPress.
These maps would be useful if the size of the counties reflected their relative population.
Comment by Thomas Paine Thursday, Dec 3, 20 @ 10:27 am
“more a sign of his strength with white collar academics than blue collar workers”
I think that’s a bit of a generalization and assumes that everyone who lives in Champaign County works as a U of I professor. If you look at the blue downstate counties on the 2020 map, those areas represent major population centers (outside of Springfield and Metro East). I don’t think it’s easy to generalize those areas.
Comment by NIU Grad Thursday, Dec 3, 20 @ 10:30 am
Interesting data. However, didn’t need a map to know the southern seven counties are as red as Alabama.
Comment by Flyin' Elvis'-Utah Chapter Thursday, Dec 3, 20 @ 10:30 am
As a younger person, I’m somewhat surprised to see how many counties outside of the Chicago area once gave more support to Democrats than Republicans.
It makes me wonder if this is due more to changes in the Democratic Party, or more to voters in those counties. I’m sure both are factors, but I would suspect that wage stagnation for the poor and the middle class has something to do with voters in rural counties turning away from the Democratic Party.
Comment by Techie Thursday, Dec 3, 20 @ 10:32 am
– but the statewide vote is in the city and the suburbs and the Republicans are just getting slaughtered. –
And rightfully so, given the way Republicans have just run this state into the ground, despite Michael Madigan’s best efforts to stop them.
Comment by JB13 Thursday, Dec 3, 20 @ 10:32 am
I forgot to add: I can tell you from experience that places like DeKalb County didn’t shift blue because of a plethora of academics in the area…NIU’s employee headcount is much lower than it was in 1992. There are more unique reasons, like socioeconomic status and diversity, that have slowly shifted the area blue over the years.
Comment by NIU Grad Thursday, Dec 3, 20 @ 10:32 am
Techie - Also a factor is population decreasing heavily in those areas. The family farm is not what it used to be (shifting more and more into big businesses) and there aren’t many other opportunities for employment. Frankly, the younger generations aren’t sticking around. This leaves the remaining population smaller, older, and more conservative.
Comment by NIU Grad Thursday, Dec 3, 20 @ 10:34 am
NIU Grad has identified what I think is the primary reason.
This is almost a population growth map, with blue being increasing population, and red being shrinking population.
Comment by TheInvisibleMan Thursday, Dec 3, 20 @ 10:45 am
Isn’t it true that Republicans often had to really cut into Democrat margins in Cook County to be able to win statewide? I’m not sure this map is a huge surprise, however, it’s amazing that within 20 years the Republicans seemed to have made gains throughout the state, but has lost some ground in teh Chicago area. Example DuPage is known as solidly Republican and that’s changed.
Comment by Levois J Thursday, Dec 3, 20 @ 10:49 am
Collapse of the UMWA, Dems swinging against fossil fuels, alienation of pro-life Dems, control of state politics shifting entirely to Chicago, and a whole lot of resentment.
Comment by AndyJD Thursday, Dec 3, 20 @ 10:50 am
==I would suspect that wage stagnation for the poor and the middle class has something to do with voters in rural counties turning away from the Democratic Party.==
Totally, because we know how hard the GOP has fought to raise wages for the poor and middle class /s
Comment by So_Ill Thursday, Dec 3, 20 @ 10:58 am
Galesburg used to carry Knox for the Democrats. If we had any fiscal flexibility I would move WIU there. The small rural counties….They are gone politically and literally.
Comment by Not a Billionaire Thursday, Dec 3, 20 @ 10:58 am
Adding to what NIU Grad said…
Having been born and raised down there on a family famr, I’d say the family farm is a romanticized version of SoILL. Yes, they existed but the area wasn’t exactly awash in farmers. For every dozen farms or so, there was a town of 2,000 folks nearby, and rthose people had to work somewhere (though many did on someone else’s farm).
Most of those folks - at least when I was growing up - worked in manufacturing. That industry no longer exists down there, but when it did, they were good union jobs and good union workers voted Democratic.
Finally, those folks - and many are my family - have ALWAYS been socially conservative, even when they were voting Democratic. So it makes a certain amount of sense that there would be a realignment of them to the socially conservative GOP
Comment by Joe Bidenopolous Thursday, Dec 3, 20 @ 10:59 am
Most of the manufacturing jobs now are in the suburbs and in metal and pharma. Rivian is in Bloomington.
Comment by Not a Billionaire Thursday, Dec 3, 20 @ 11:07 am
Levois J, not just DuPage, but Kane, Will, and even Kendall County is more Democratic. In Kane and Will, the urban centers of Elgin, Aurora and Joliet are minority-led. DuPage is more interesting. The precinct I reside in, voted Republican; less than a mile away, decidedly Democrat.
Comment by bogey golfer Thursday, Dec 3, 20 @ 11:07 am
“It makes me wonder if this is due more to changes in the Democratic Party, or more to voters in those counties.”
As many in society progress, such as recognizing LGBTQ+ rights, legalizing marijuana, criminal justice reform demands, working toward universal health insurance, etc, many others don’t want to move forward. Right now the US House is on the verge of voting on marijuana legalization, as the floor vote is scheduled for tomorrow. The GOP is the party of yesterday (but hopefully some/many GOP will vote for legalization).
Comment by Grandson of Man Thursday, Dec 3, 20 @ 11:12 am
@So_Ill
You’re right of course that the Republican Party has offered virtually nothing to increase wages for the poor and middle class. But what I was implying is that Democrats haven’t done much to help them out, either. Despite things like increasing the state minimum wage (a recent and ongoing development, for one), they failed at many other junctures to make good on promises that would have helped (Obama never passed card check for unions like he had campaigned on, Democrats continue to push bad trade deals like the TPP, etc).
Given that many voters feel (rightly or wrongly) that neither party is going to do much for them economically, as Joe Bidenopolous said above, these voters who are socially conservative could then conclude that they should vote GOP so that at least they can have someone who represents them on social issues.
Comment by Techie Thursday, Dec 3, 20 @ 11:18 am
Lee Daniels strategy was downstate would be the GOP’s path back to a majority.
How’s that working out?
Comment by Leigh John-Ella Thursday, Dec 3, 20 @ 11:19 am
The changes in the map really show the division today compared to 20 years ago. There doesn’t appear to be any counties in 1996 >50% in either direction outside of Gallatin. 2020 map wow. I don’t know much about southern Illinois but Gallatin switching from >50% Blue margins in 1996 to >30% republican margins in 20 years is quite a swing.
Comment by 1st Ward Thursday, Dec 3, 20 @ 11:23 am
===This is almost a population growth map, with blue being increasing population, and red being shrinking population.===
This being Illinois, there are only a handful of counties that are actually growing in population. Of the few that are growing, it is true that Kane, Kendall, Champaign, and Will are trending more D, but that in the high growth counties, there are still a lot of Rs, and I would think a lot of ticket-splitting where a vote for one office would not be totally indicative of the trend.
Comment by Six Degrees of Separation Thursday, Dec 3, 20 @ 11:30 am
One more thought. This is bigger than Downstate Illinois. The failure of Democrats in small and medium sized cities, rural, manufacturing areas is why 45% of the congressional seats being redistricted will be by Republican state legislatures (versus only 19 by Democrats). It’s why the US Senate is red and the US House is almost red. When you get out of the blue bubble, reality hits you.
Comment by west wing Thursday, Dec 3, 20 @ 11:58 am
===Lee Daniels strategy was downstate would be the GOP’s path back to a majority.
How’s that working out?===
Where else was he to go? Silly drive by comment. As the 1996 map shows, the suburbs were mainly red. So Daniels had to go to the blue counties… which were downstate.
Comment by Nagidam Thursday, Dec 3, 20 @ 12:00 pm
Four years ago the Trib published a series of 6 maps covering the presidential vote. That graphic shows the gradual change in the voting patterns over 20 years, interrupted in 2008 by the surge for Obama.
https://www.chicagotribune.com/data/ct-illinois-president-results-20161108-htmlstory.html
Comment by muon Thursday, Dec 3, 20 @ 12:01 pm
This is a very good article related to this topic of the rural shift in general. Its a topic that we have polled on and advised on for more than two decades.
topic.https://www.politico.com/news/magazine/2020/12/01/democrats-rural-vote-wisconsin-441458
Comment by Dave Fako / Fako Research & Strategies Thursday, Dec 3, 20 @ 12:03 pm
I remember when Olney elected Terry Bruce.
Comment by Springfieldish Thursday, Dec 3, 20 @ 12:13 pm
Didn’t the cook burbs used to be predominantly Republican as well? It was a big deal when the south burbs came out against Salvi if I remember.
Comment by cermak_rd Thursday, Dec 3, 20 @ 12:15 pm
The trend in the collar counties is huge
Comment by Siriusly Thursday, Dec 3, 20 @ 12:26 pm
It is a function of how ‘white’ the regular readers/posters here are that the conversation can get this far without anyone mentioning race.
After the 2016 election, there was a lot of instant punditry about ‘economically anxious’ voters. Further research showed that the real driver was whites’ resentment over a sense of losing ‘their place’.
I think the same applies to the shift downstate. There’s a reason the souuthern counties vote just like Alabama.
Comment by Rasselas Thursday, Dec 3, 20 @ 12:27 pm
- Rasselas -
Old, angry, white, rural… are voting R.
It’s been brought up.
Comment by Oswego Willy Thursday, Dec 3, 20 @ 12:32 pm
What the map doesn’t show is that the counties won by Biden and Durbin contain 75% of Illinois estimated 2020 population.
Comment by train111 Thursday, Dec 3, 20 @ 12:50 pm
My home county is Coles. I grew up in a fairly big town for area, 19,200 in a town about 50 mi south of Champaign on I-57. When I was a kid it had lots of factories (Tub-loc, Youngs Radiator, Ampad to name a few). Those factories were closing one by one in my high school years. Of my class (85) most of us moved elsewhere for school or work. The same is true of class of 86, 87, 88, 89… my niece’s class in the 90s was the same way. Population today is 17,729. It’s not that the townspeople did not prepare their family’s for the future. They did, they sent their kids to college and into the military and off to apprenticeships and the kids probably did well in their new adopted home towns. So now you have old people, people who stayed due to family obligations (needing to help an aged parent etc), a small handful of professionals (doctors–often immigrants, lawyers, teachers, funeral industry workers), first responders, and the small group of leftovers broadly described as those who had little talent or ambition to do anything better with their lives than complain that they can’t go work at Tubloc like their father or uncles could.
Comment by cermak_rd Thursday, Dec 3, 20 @ 12:50 pm
Race and college attainment are the top predictors of political affiliation — in Illinois and every where else. The map reflects that.
Comment by Roman Thursday, Dec 3, 20 @ 1:02 pm
A lot factors involved in this change in voting patterns, passing of the children and young adults of the depression, young people not returning from college, corporate agricuture, Wal-Mart, etc.
I also think the end of patronage is an Illinois specific factor. With patronage everyone had a kid or in law that needed a job. People had a stake in state government. Without it downstate Democrats were lost. Republicans could attack Chicago and state government at will and at the same time,like Madigan, find jobs for loyalists..
Comment by Beecher Thursday, Dec 3, 20 @ 1:06 pm
I think it has to do with Trump’s income tax changes. My guess is in those areas a lot of people had bigger SALT deductions than Trump’s income tax standard deduction gave them. Many other reasons but that one hits you in the wallet.
Comment by My Explanation Thursday, Dec 3, 20 @ 1:22 pm
this whole more counties are red thing is popular with the Trump crowd and their nationwide maps. harkens back to the days when property was a requirement for voting.
Comment by Amalia Thursday, Dec 3, 20 @ 1:31 pm
Anyone have a link to election data in spreadsheet format? The media web sites are not helpful.
Thanks
Comment by Friendly Bob Adams Thursday, Dec 3, 20 @ 1:51 pm
==counties won by Biden and Durbin contain 75% of Illinois estimated 2020 population.===
This is why the trend is not as worrisome for Dems in Illinois, but the effect is different when fleeing youth leave rural states altogether for the coasts.
Comment by Jibba Thursday, Dec 3, 20 @ 2:24 pm
A lot of us University types just didn’t vote in that category. I’m not voting for him, but I’m not voting against him.
His cybersecurity/privacy beliefs are my main impetus.
Comment by Stuff Happens Thursday, Dec 3, 20 @ 2:31 pm
The county level data shows a correlation of .713 between the percentage voting for Trump in 2020 and the percentage of Non-Hispanic White population in 2019.
Comment by Friendly Bob Adams Thursday, Dec 3, 20 @ 2:35 pm
In the 88 counties won by Trump the population is 84.4 percent Non-Hispanic White. In the 14 counties won by Biden the population is 52.2 percent Non-Hispanic White.
Comment by Friendly Bob Adams Thursday, Dec 3, 20 @ 2:47 pm
I’m increasingly skeptical that maps like this tell us anything useful. For example, collar counties increasingly voting D doesn’t mean that people are becoming more liberal, simply that Democrats moved out of the city and into the suburbs. The real questions are which people are changing party affiliation and why.
Comment by Ben Tre Thursday, Dec 3, 20 @ 3:18 pm
Correcting a data error..
The county level data shows a correlation of .801 between the percentage voting for Trump in 2020 and the percentage of Non-Hispanic White population in 2019.
In the 88 counties won by Trump the population is 86.4 percent Non-Hispanic White. In the 14 counties won by Biden the population is 52.3 percent Non-Hispanic White.
Comment by Friendly Bob Adams Thursday, Dec 3, 20 @ 3:22 pm
My small central IL county used to be reliably Dem. This year it went Trump 2-1 Times are changing.
Comment by Bruce( no not him) Thursday, Dec 3, 20 @ 4:34 pm
For myself, a college educated Non-Hispanic White, the top issues are a pro-life and pro-2A candidate. Haven’t had a Dem one of those since Poshard. Probably not going to be another any time soon. Like it or not the R’s will get a lot of like minded votes because of it. And we’ll lose all day long in Illinois.
Comment by Papa2008 Thursday, Dec 3, 20 @ 4:51 pm