Latest Post | Last 10 Posts | Archives
Previous Post: Jim Nowlan’s column on hiatus until “at least” after the election
Next Post: Yet another day, yet another lawsuit - this time on cannabis
Posted in:
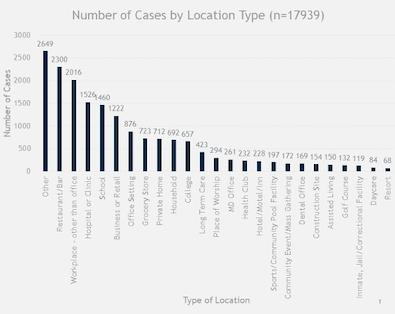
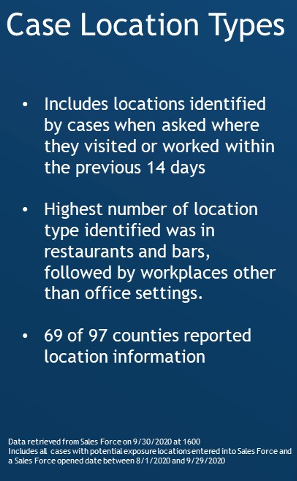
* What follows are the results from contact tracing efforts in Illinois between August 1 and September 29. “Other” is described as a catchall for anything not covered by the specific categories below, including things like vacations, family gatherings, weddings and college parties….
Click the pics for a larger image. The graph was provided by the governor’s office.
Discuss.
posted by Rich Miller
Monday, Oct 5, 20 @ 11:06 am
Sorry, comments are closed at this time.
Previous Post: Jim Nowlan’s column on hiatus until “at least” after the election
Next Post: Yet another day, yet another lawsuit - this time on cannabis
WordPress Mobile Edition available at alexking.org.
powered by WordPress.
This… is a good start.
Breaking down those outbreaks by County or at least which of the state’s 11 regions (where masks and distancing are, and are not being enforced) and whether employee or customer associated would be a big, even huge, improvement.
Michigan has been doing their reporting that way for quite awhile (by 2020 pandemic standards).
https://www.michigan.gov/coronavirus/0,9753,7-406-98163_98173_102057—,00.html
Comment by ChicagoBars Monday, Oct 5, 20 @ 11:17 am
Good luck to all the bars and restaurants who have the next four weeks to make their year.
It’s going to be an absolute massacre of the service industry this winter without federal help, which means you can just ignore the three words I wrote after “winter.” This is bad for everyone.
Comment by Roadrager Monday, Oct 5, 20 @ 11:19 am
They should add categories so as to break other into smaller buckets.
I’m curious what is a non office workplace. More clarity there would be nice.
Comment by Fav Human Monday, Oct 5, 20 @ 11:27 am
Jeez, who designed that graph? Gray on gray? And you have to turn your head sideways to read the text.
Graphics design aside, it’s interesting.
Comment by JoanP Monday, Oct 5, 20 @ 11:28 am
The top line was known weeks ago after a CDC report.
“Adults With COVID-19 Twice As Likely To Have Eaten At Restaurants, CDC Study Finds”
So we’ve come to know just how many infections and deaths we are willing to accept to leave those places open.
Comment by Cool Papa Bell Monday, Oct 5, 20 @ 11:31 am
If I understand the blue notes, this describes where people had been in the last 14 days. Not necessarily where they got infected. Most people have been to a restaurant in the last 14 days, even if it was in a tent setting. Most people have not been to the items on the far right. I’d like to see a graph of categories containing exact places where the cases intersected at. Such as restaurants( and the non published data lists a specific address of identified coincidences).
Comment by thoughts matter Monday, Oct 5, 20 @ 11:43 am
We need to aggressively fight Other.
Comment by The Captain Monday, Oct 5, 20 @ 11:45 am
What I don’t love about this chart is that it doesn’t break out whether these cases were “as a worker” or “as a visitor” – I assume that working at some of these places is a lot more dangerous than merely visiting.
I suppose from a “we want to reduce overall cases” perspective it doesn’t really matter, but if I’m trying to adjust my personal behavior to calibrate my individual risk, I’d like to know.
Comment by lincoln's beard Monday, Oct 5, 20 @ 11:50 am
I agree that more details would be helpful. If sonmeone’s an employee at a restaurnant is that classified as work other than office or as bar/restaurant? Also, I’d like to see an indoor vs outdoor dining comparison. School is in the top 5 and sure to move up in the future.
Comment by data Monday, Oct 5, 20 @ 12:12 pm
Yeah, I think it’s important to make clear how many of these are people who work in bars/restaurants (and who therefore may be infecting each other in crowded kitchens, etc) and how many are out in front. I say this not because I don’t care about restaurant/bar workers, but because I don’t want people to stop going and spending money if the public areas are relatively safe.
Comment by Soccermom Monday, Oct 5, 20 @ 12:22 pm
Where does Government offices fall in this chart? Under “business and retail,” “Office other than workplace,” or Other?
For example, there’s been a few SOS offices since their reopening June 1 that had to temporarily close due to an employee getting tested positive.
Comment by Chatham Resident Monday, Oct 5, 20 @ 12:41 pm
=Most people have been to a restaurant in the last 14 days, even if it was in a tent setting=
How bout some data to back up that claim? Anecdotally, it’s not even close to “most” in my neck of the woods
Comment by Joe Bidenopolous Monday, Oct 5, 20 @ 2:13 pm
===I’m curious what is a non office workplace===
Literally every workplace that isn’t an office. Construction sites, retail/service stores, garages, warehouses, etc. etc.
Comment by Cubs in '16 Monday, Oct 5, 20 @ 2:14 pm
Jail looks like one of the safest places. Let’s send everyone in a restaurant or bar to jail.
Comment by Groucho Monday, Oct 5, 20 @ 3:01 pm
I agree with the others — this is a useless chart because it doesn’t identify where transmission occurred, just places people have been. That and it’s impossible to read.
Comment by Liz Tuesday, Oct 6, 20 @ 9:54 am